Attention: the Quickstart Guide for BSP 2.8, based on the Ångström distribution, is not being updated anymore. Depending on your SoM, you have different options:
Vybrid and Tegra: the information is provided as-is and still accurate, since newer Toradex BSPs are not ported to those SoMs. Just keep in mind that the Guides are not being maintained anymore, even if we find bugs or outdated instructions.
Apalis TK1 (all variants), Colibri iMX6ULL (all variants), Colibri iMX7S 256MB and Colibri iMX7D 512MB: these computer on modules are still regularly maintained in our BSPs and, to get started, you must check the software page Toradex BSP Layers and Reference Images for Yocto Project. Since Torizon is not supported, at the moment a Quickstart Guide is not available.
All other i.MX-based SoMs: you have two options to get started with embedded Linux: the first is to follow the Quickstart Guide for Torizon, which provides the greatest out-of-the-box experience, or if you choose to use Yocto, check the software page Toradex BSP Layers and Reference Images for Yocto Project.
This section of Module 2 will help you to configure the debug environment, in order to deploy the code to the target and debug it.
Information provided in this section was based on the Hello World application on Embedded Linux article from Toradex' knowledge-base.
In this module you will:
In the top-right corner of the window:
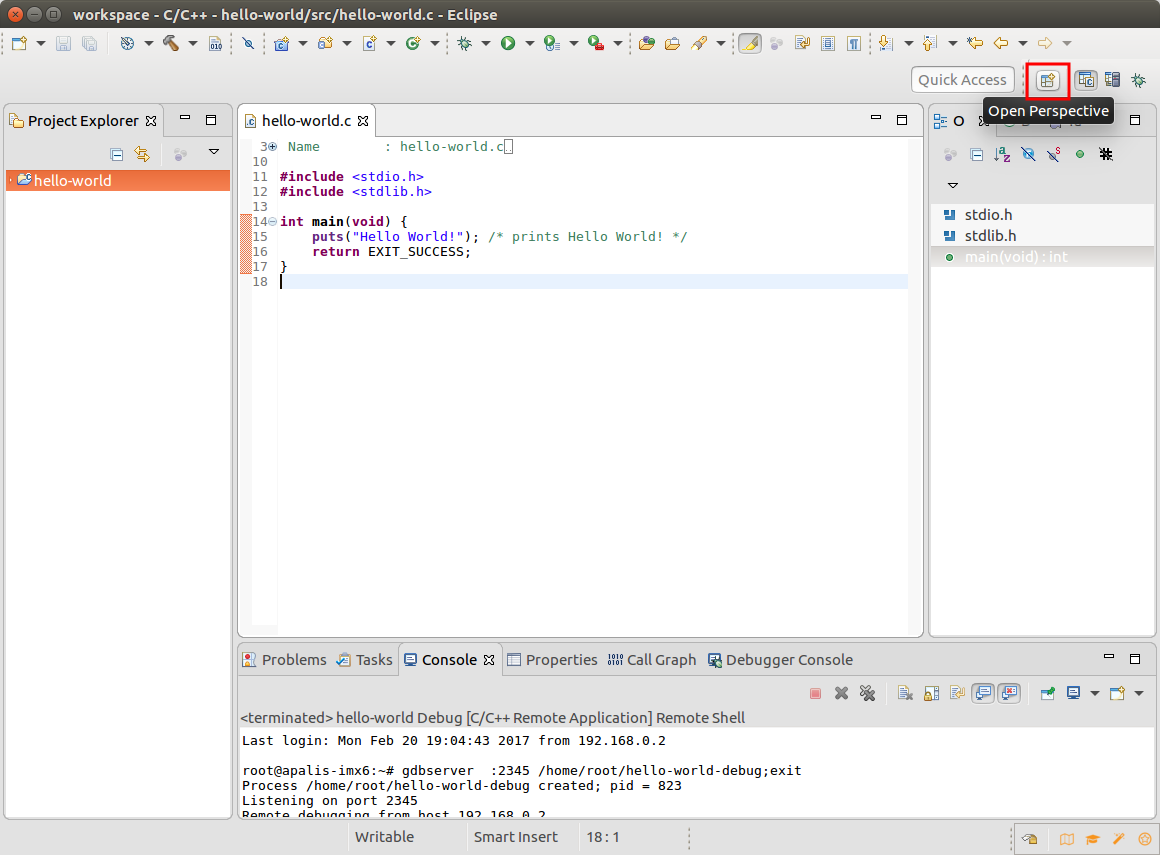
Open a new perspective
From the Open Perspective list:
-Select Remote System Explorer
Note: Should the Remote System Explorer not be installed yet, you may do so at Help - --All Available Sites-- (from the
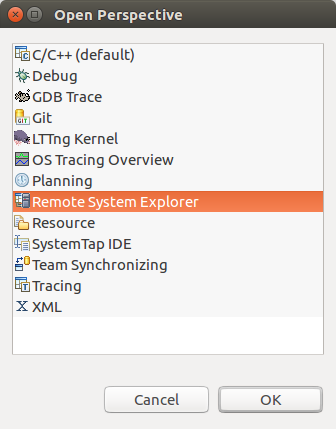
Select the Remote System Explorer perspective
The IDE will open a different set of tabs, i.e. a new perspective, meant for accessing a remote device. We are interested in the Remote Systems tab to the left:
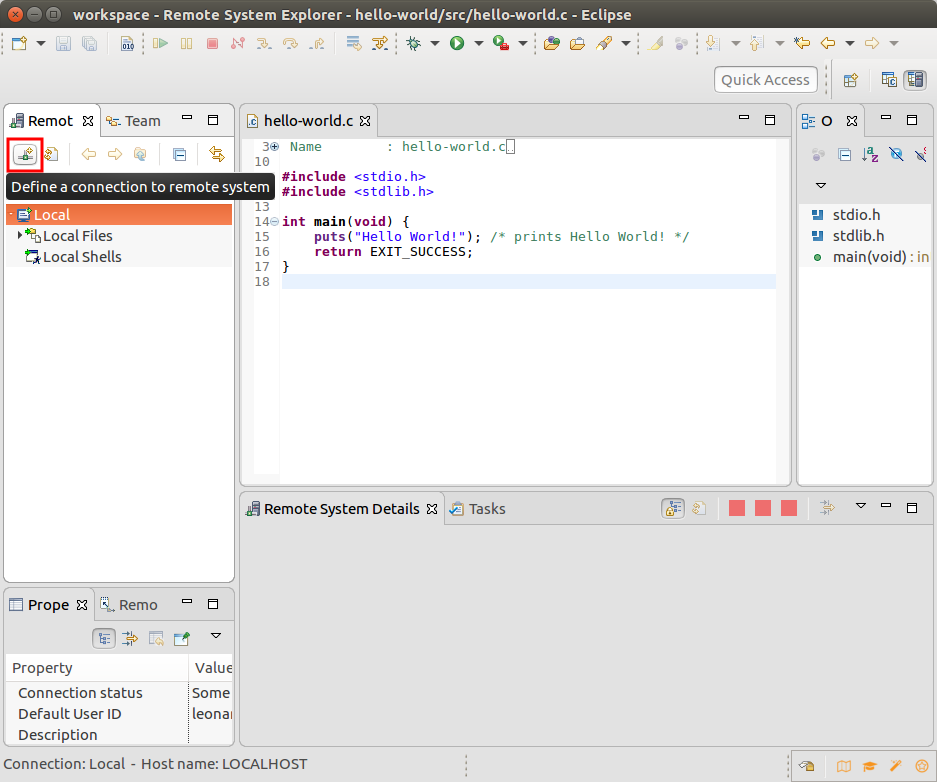
Remote System Explorer perspective
A window will open. From the list:
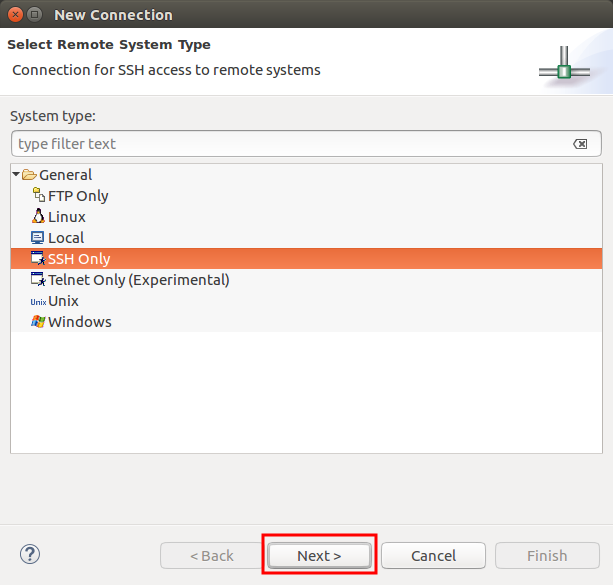
Create an SSH connection
Fill the fields:
Note: If your network allows, it might be practical to set the board IP as static. Please consult this article for more information.
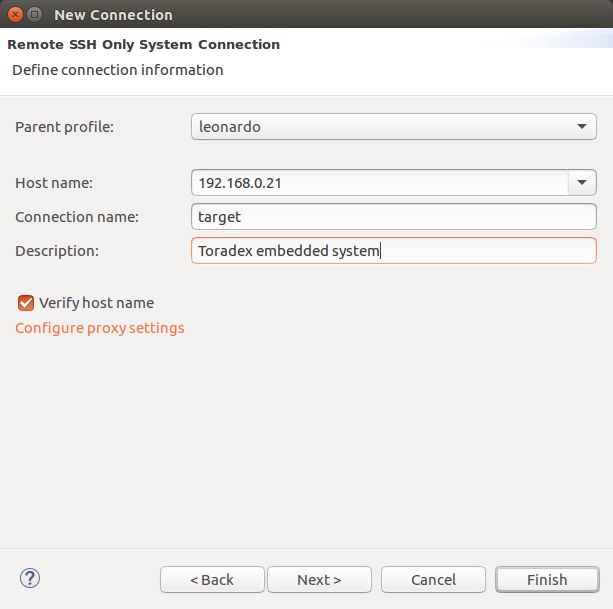
Configure the SSH connection
The new connection will be listed in the Remote Systems tab. Right-click it and:
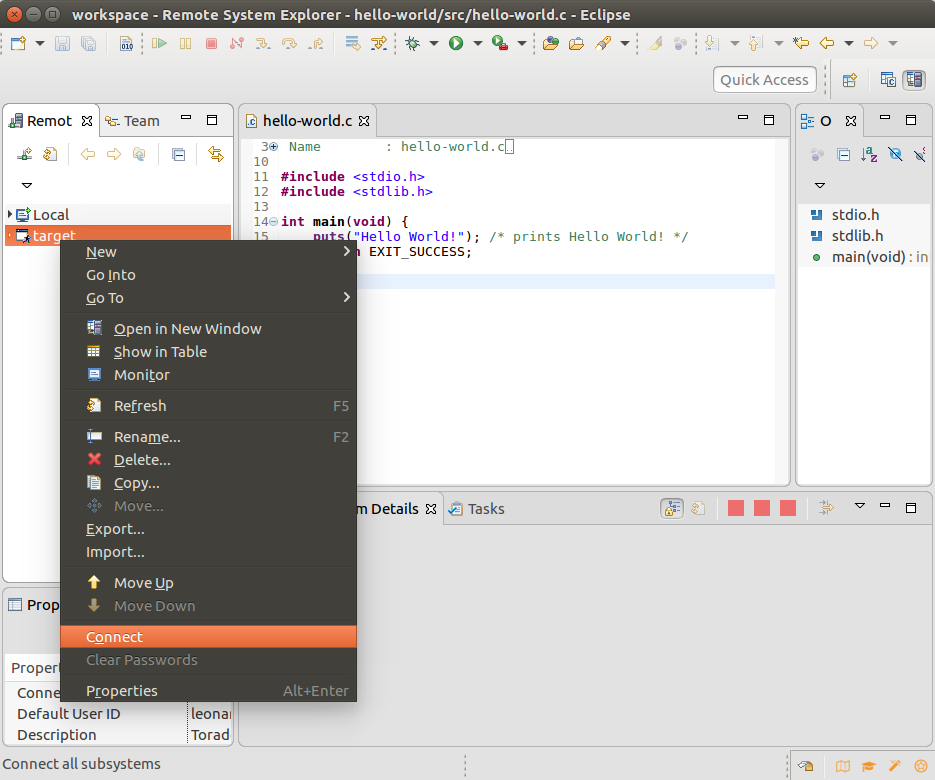
Connect to the recently created device
In the Enter Password pop-up window, you need to enter login details for the board connected:

Login request
You may be prompted to accept the host authentication. Click yes:

Accept the authentication
Use the Remote Systems tab to navigate the target filesystem:
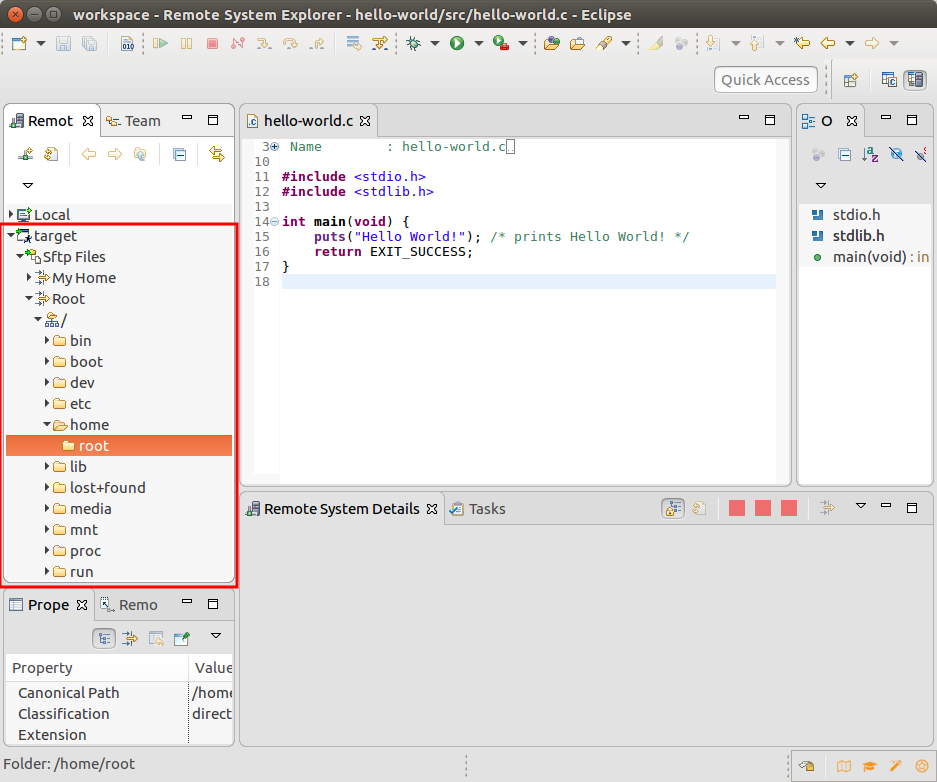
Target filesystem
Here you can browse the target board contents using the SFTP protocol, as displayed in the picture above.
Switch back to the C/C++ perspective using the button in the top-right corner. Right-click the project in the Project Explorer tab:
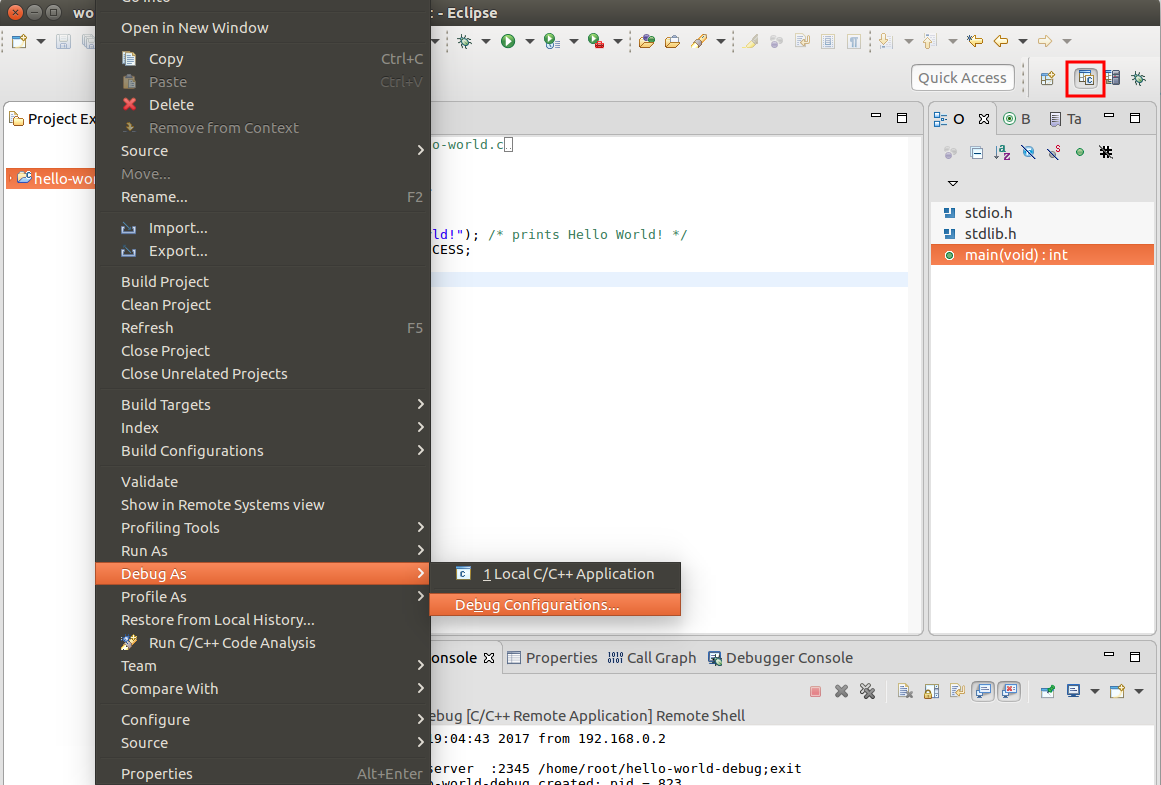
Configure the debug options
Maximize the C/C++ Remote Application options and select hello-world Debug. If there are no options to select, right-click the C/C++ Remote Application and select the new option. In the Main tab:
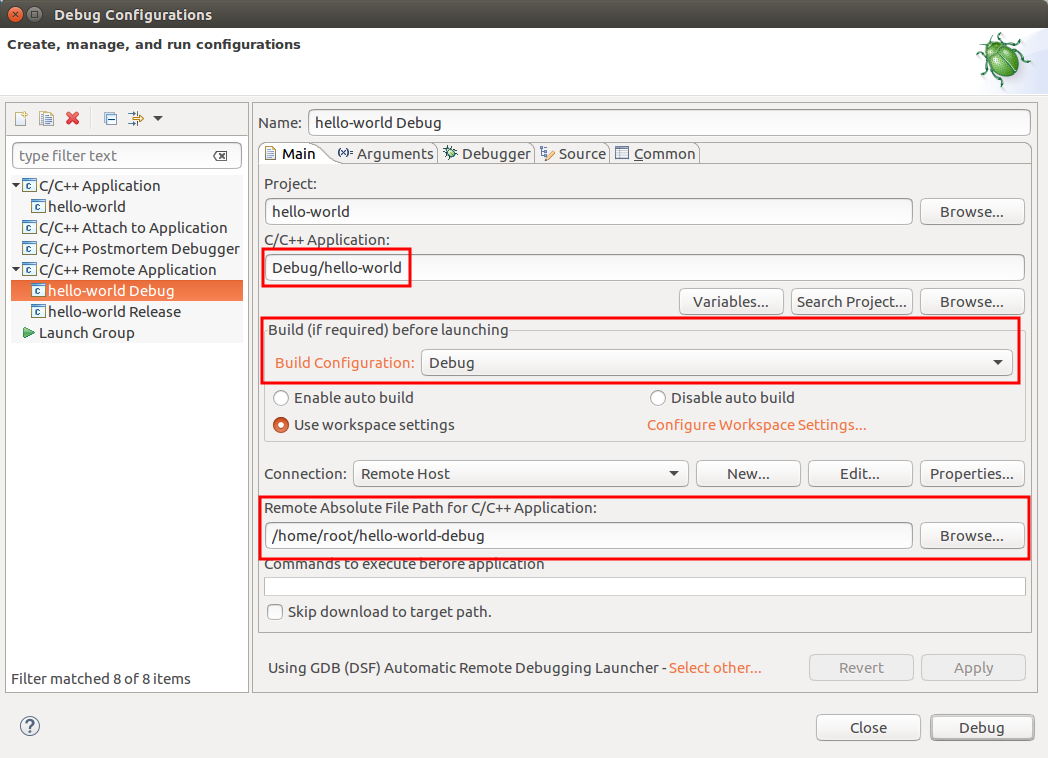
Main debug configuration tab

Create a new connection
From the dropdown menu in the Create a New Connection pop-up window:

SSH connection
In the Edit Connection pop-up window, fill the fields:
Select "Password based authentication" instead of "Public key based authentication".

SSH connection configuration
Switch to the Debugger tab. Replace the GDB Debugger field with "arm-angstrom-linux-gnueabi-gdb", such as illustrated in the figure below:
arm-angstrom-linux-gnueabi-gdb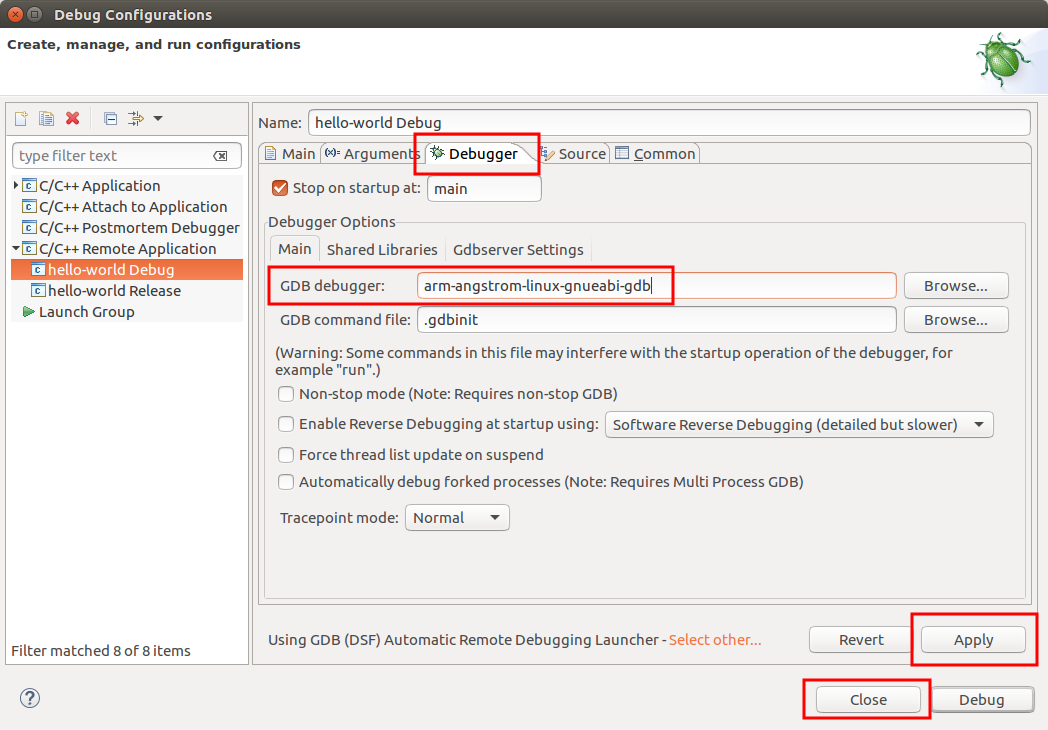
Using GDB from the SDK
Click the Close button.
Right-click the project in the Project Explorer tab:
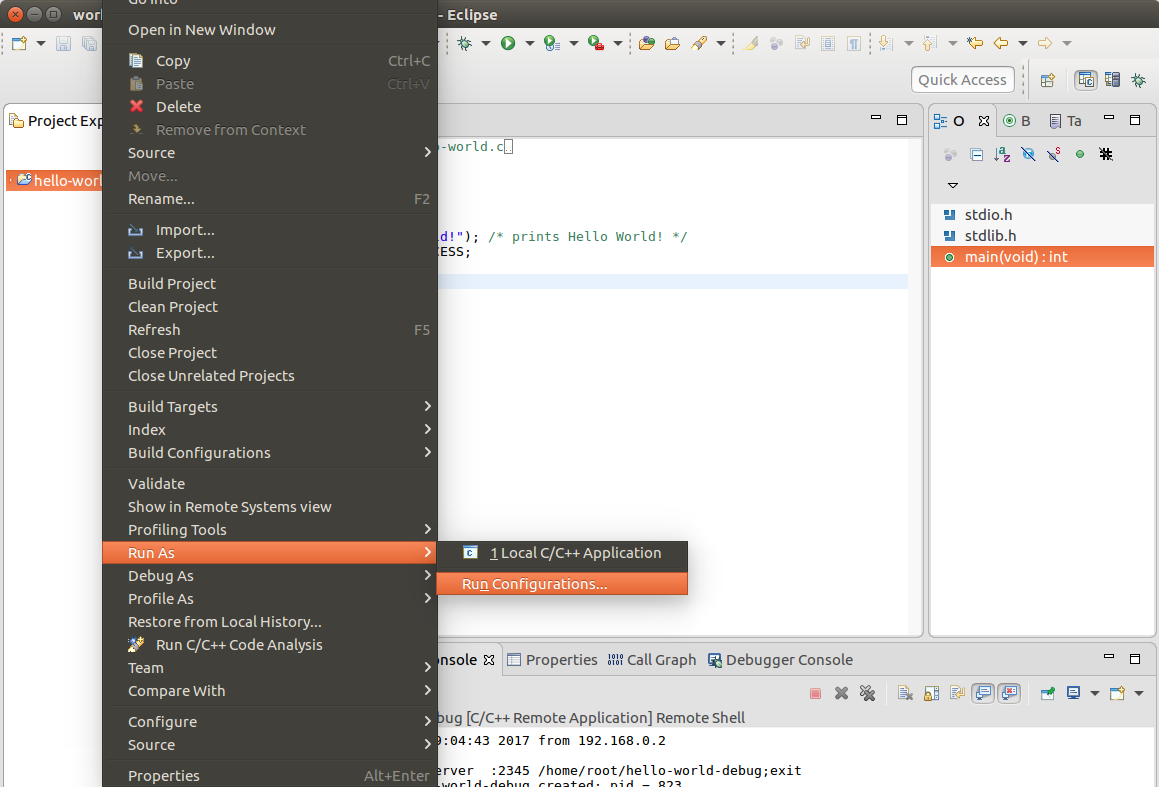
Configure the run options
Maximize the C/C++ Remote Application options and select hello-world Release. If there are no options to select, right-click the C/C++ Remote Application and select the new option. In the Main tab:

Main debug configuration tab
Click the close button.
Edit the source-code to add a loop, therefore you can debug it in the next steps:
#include <stdio.h>
#include <stdlib.h>

int main(void) {
	int mul = 1, i;

	puts("Hello World!"); /* prints Hello World! */

	for(i = 0; i < 5; i++){
		mul = 2*mul;
		printf("Loop %d - mul=%d", i, mul);
	}

	return EXIT_SUCCESS;
}
Back to the C/C++ perspective, you will find two buttons in the top-left corner of the window. Both of them are used to build the application. The buttons are highlighted in the picture below:
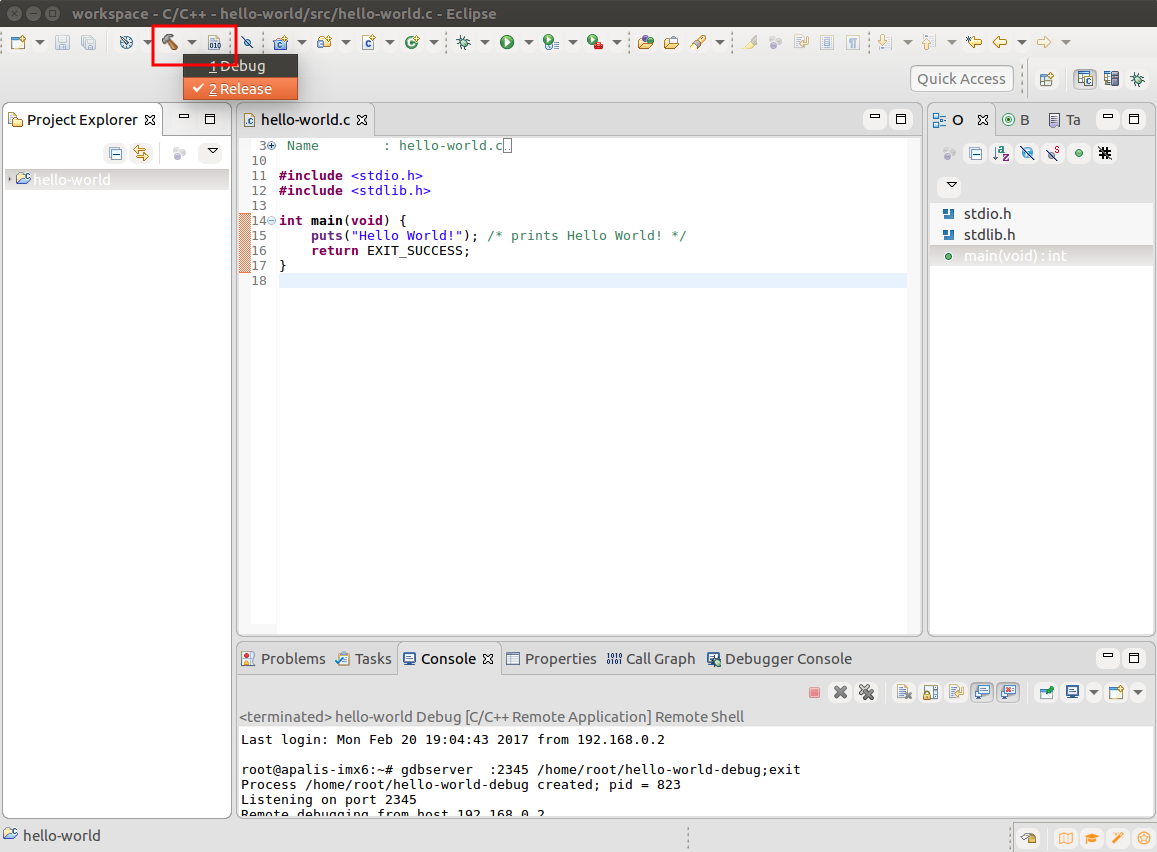
Build buttons
There are two buttons to debug or run the application. They are highlighted in the picture below:
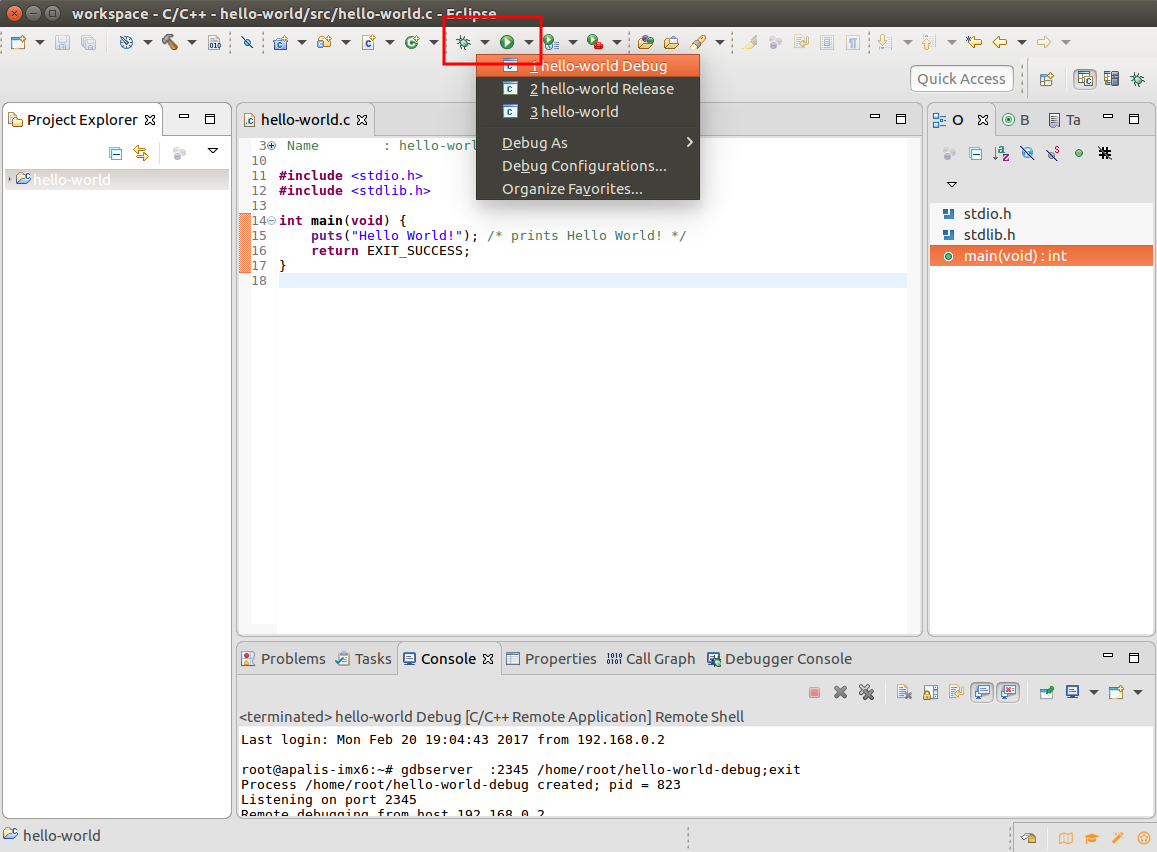
Debug and Run buttons
Warning: Sometimes, mostly after restarting Eclipse, the debug may fail for the first time you try to run it. Just try again and it might work.
A pop-up window will tell you that the perspective will be switched to the debug perspective.
Note: You can always switch perspectives through the buttons in the top-right corner.
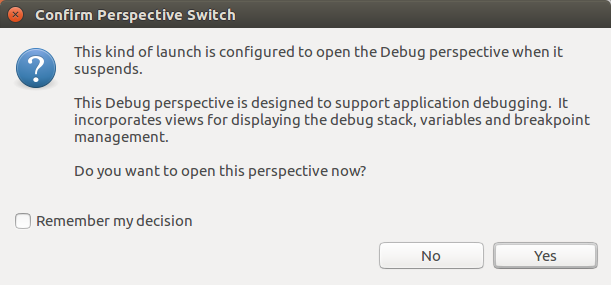
Warn about perspective switch to the debug mode
The debug perspective provides information and useful features in many different places:
The picture below presents the debug perspective when it is started. The program will be halted in the first line of the main function. Take some time to get used to this perspective:
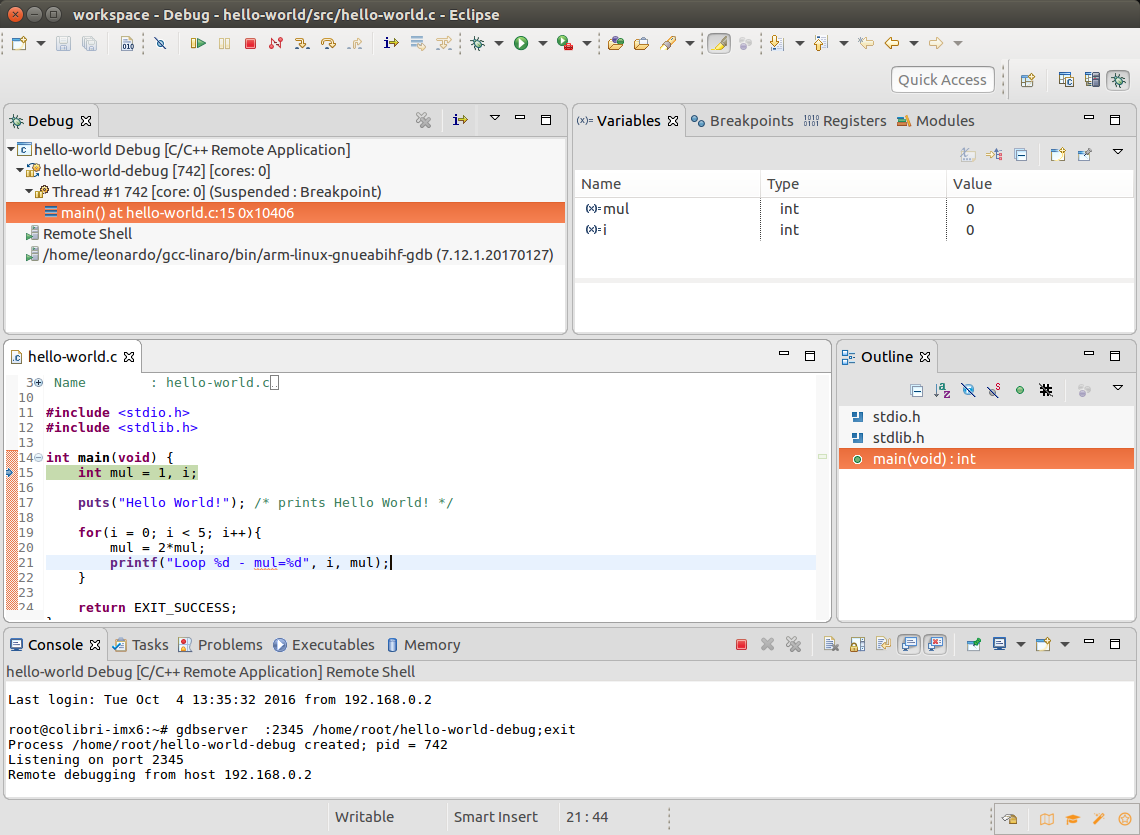
The debug perspective
Add a breakpoint to the line 20:
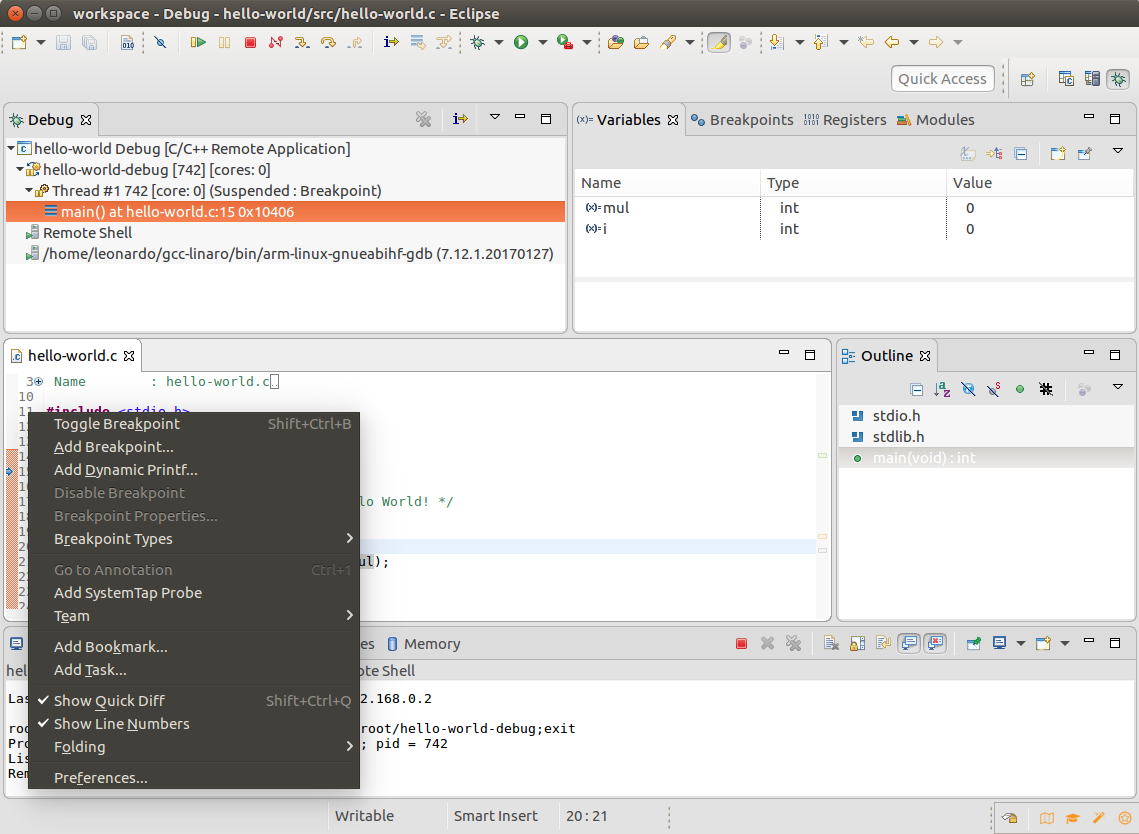
Adding a breakpoint by right-clicking the line number
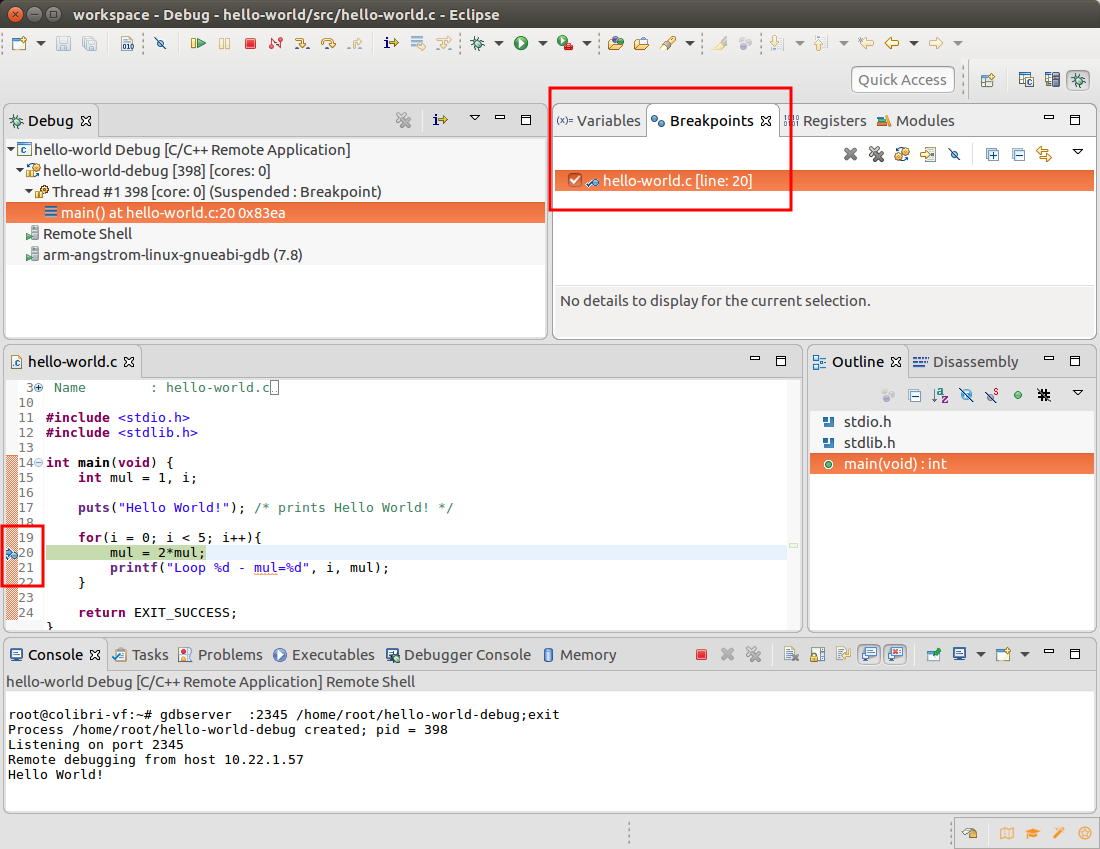
Breakpoint added - the areas of interest are highlighted
Run the program:
Run step-by-step:
Keep pressing F5 while looking at the Variables tab. The values of i and mul will change as the for loop is executed. The last line to be executed is the return EXIT_SUCCESS;. By then, the Variables tab should look like this:

Variables updated as the code is executed
This lesson covers the basics of Eclipse IDE debugging, therefore this FAQ section is meant as an information complement.
